


Research prepared exclusively for NRI Travelogue
Key finding: The questions people type when they plan a trip are changing in kind, not just in volume. Between June 2024 and May 2026, the share of “trip planning”, “travel planning” and “travel itinerary” related searches that include the word “AI” rose from 5.5% to 14.2%. Safety became a leading planning question in its own right: “is it safe to travel right now” is the top related search for its question group, ahead of any single country. Visa questions about the United States overtook those about the United Kingdom. And, in the same period, 17 of 30 planning searches stepped up together in the summer of 2025, a pattern that looks more like a change in how searches are counted than a change in how people travel. We report that step, rather than build a 2027 forecast on it.
This article measures what people ask and what the news writes about, not bookings or trips taken. It cannot measure 2027, which has not happened. It asks a narrower question: which planning questions are moving up to October 2026, and how far can each movement be trusted?
What was compared
We looked at four kinds of evidence, all worldwide unless stated. First, the leading related searches for nine planning questions (“how to plan a trip”, “trip planning”, “travel planning”, “travel itinerary”, “best time to visit”, “is it safe to travel”, “travel insurance”, “visa requirements” and “where to travel”), in two 12-month windows: June 2024 to May 2025 and June 2025 to May 2026. Second, weekly search interest for 30 planning searches from January 2022 to October 2026, grouped into five stages of a trip: inspiration (for example “where to travel”, “hidden gems”, “solo travel”), timing and safety (“best time to visit”, “is it safe to travel to”), paperwork and connectivity (“visa requirements”, “travel insurance”, “eSIM for travel”), cost (“cheap flights”, “budget travel”) and itinerary and tools (“travel itinerary”, “packing list”, “AI travel planner”). Third, search interest for “best time to visit” among people in 18 countries. Fourth, the topic themes carried by news and blog coverage of 12 planning terms, in the same two windows.
Official statistics on trips taken, such as Eurostat’s tourism statistics (Eurostat, no date), measure travel that happened. Search and news data measure attention, which comes before a trip and is not the same as it. That gap is the reason for the cautions below.
Finding 1: The leading planning searches ask about places, then about “right now”
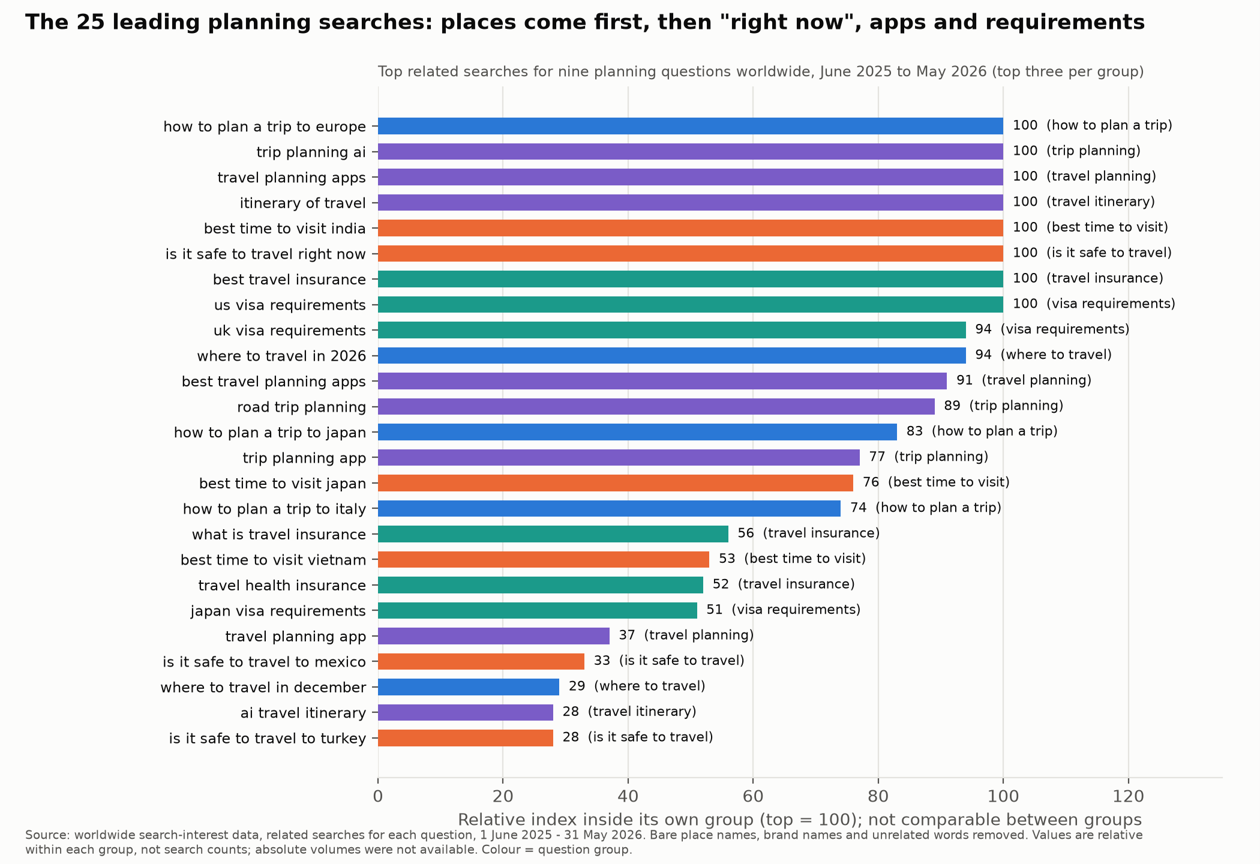 The 25 leading planning searches
The chart shows the 25 highest-ranked related searches for the nine questions, taking the top three from each group, in June 2025 to May 2026. Values are relative within a group (the group’s top search is 100) so they show order inside a group, not volume between groups. The pitch for this article promised the top 25 searches and their volumes. Absolute volumes were not available from the sources we could use, so the figures here are relative.
Three patterns stand out. First, trips are planned around a handful of places. “How to plan a trip to Europe” leads its group (100), followed by Japan (83) and Italy (74). For “best time to visit”, India (100) leads Japan (76), Vietnam (53), Thailand (52), Canada (41) and Europe (35). In the earlier window Japan led (89) with India second (86), and Canada did not appear among the first nine.
Second, safety moved from a country question to a time question. In June 2024 to May 2025 the leading related search for “is it safe to travel” was a country: Mexico (100), then India (70), Turkey (69) and Egypt (63). In June 2025 to May 2026 the leader was “is it safe to travel right now” (100), and Mexico fell to 33. People were asking about the present state of a place more than about a place’s reputation. The news side agrees on direction: articles mentioning “travel advisory” worldwide rose from 1,186 to 2,057 between the two windows (+73%), with a peak in March 2026.
Third, the paperwork questions changed order. For “visa requirements”, the United Kingdom led in the earlier window (100) with the United States second (89). In the recent window the United States led (100) with the United Kingdom at 94, and Germany (42), China (37) and Spain (32) entered the first nine. We did not test why.
Finding 2: AI has entered the vocabulary of planning, unevenly
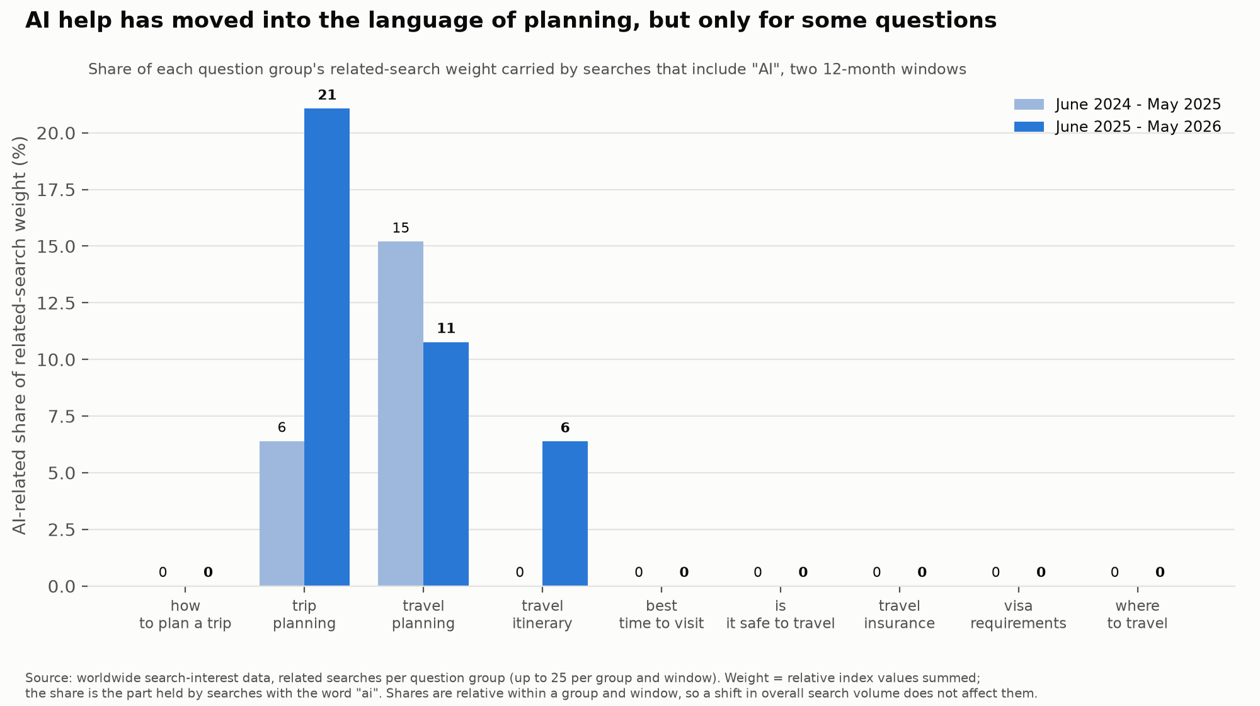
AI-related share of related searches, by question
We counted how much of each group’s related-search weight sits on searches that include the word “AI”. For “trip planning” the share rose from 6.4% to 21.1%: “trip planning ai” went from 31 to 100 and became the top related search, and “ai for trip planning” went from 16 to 50. For “travel itinerary” it went from 0 to 6.4%, because “ai travel itinerary” entered at 28. Pooling the three groups that carry any AI language, the share rose from 5.5% to 14.2%.
It did not rise everywhere. For “travel planning” it fell from 15.2% to 10.8%, because the leading searches turned to apps (“travel planning apps” and “best travel planning apps” took 100 and 91) while “travel planning ai” (39 earlier) dropped out of the first nine. In six other groups, including “best time to visit”, “is it safe to travel” and “travel insurance”, no AI search appeared in either window. The picture is one of AI as a tool for building the plan, meaning the itinerary and the sequence of days, and not yet for the choice of when, whether or on what terms to go.
Brand names also moved. In the earlier window three insurer-brand searches held three of the first nine places for “travel insurance”; in the recent window none of the first nine did, and general questions took their place (“what is travel insurance”, 56). A mapping product’s name held two of the nine for “how to plan a trip” and a travel product’s name was fifth for “travel itinerary” (60); both lost ground. The searches that gained are descriptions of a need, not names of a product.
Finding 3: Seventeen planning searches stepped up together in summer 2025
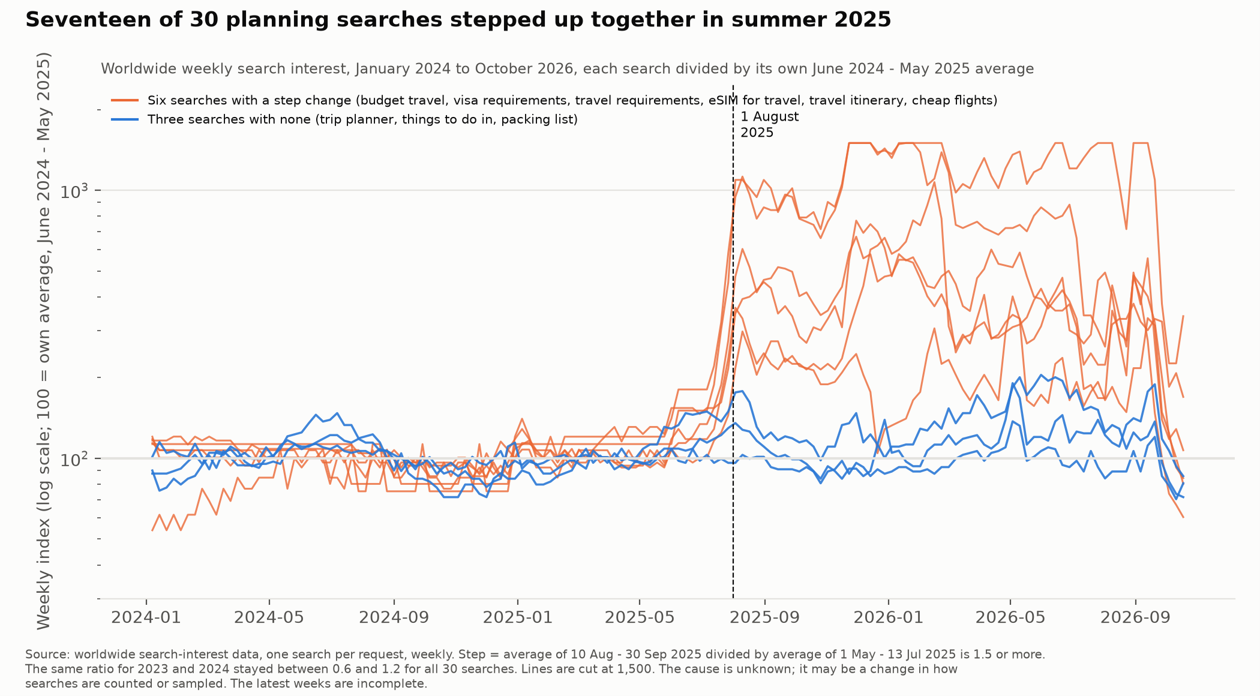
A step change in 17 of 30 planning searches
The weekly series for 30 planning searches carry a break that we did not expect. For 17 of the 30, the average of 10 August to 30 September 2025 was at least 1.5 times the average of 1 May to 13 July 2025. For budget travel the ratio was 7.3, for travel requirements 5.8, for digital nomad visa 4.8, for visa requirements 4.3 and for the cheapest time to fly 3.8. The same ratio for 2023 and 2024 stayed between 0.6 and 1.2 for every one of the 30 searches. The other 13 show no step, including “trip planner” (0.96), “things to do in” (1.03), “packing list” (1.01) and “places to visit” (0.94).
A step this size, across unrelated searches in the same few weeks, is not how travel demand usually moves. Two checks point in different directions. News coverage did not move in step: articles mentioning “budget travel” were 577 in the earlier window and 590 in the recent one (+2%), and those mentioning “visa-free travel” fell from 1,145 to 842 (-26%). On the other hand, when we requested four of the searches (budget travel, visa requirements, travel requirements, travel insurance) separately for the United States, United Kingdom, India, Canada and Australia, all 20 country series were higher in June 2025 to May 2026 than in the 12 months before, by 26% at the least and by more than 800% for “travel requirements” in India. In those country series the rise is gradual, with no one-week step.
We cannot tell whether this is a change in how people plan, a change in how searches are counted or grouped, or automated traffic. What the data do support is that the size of the worldwide rise from 2025 onward, which is 47% for “best time to visit” and 102% for “travel insurance” in our worldwide series, should not be read as a forecast. For this reason the rest of the search findings use two things that the step does not touch: changes measured before it, and shares inside a question group.
Finding 4: Before the step, tools and safety were growing
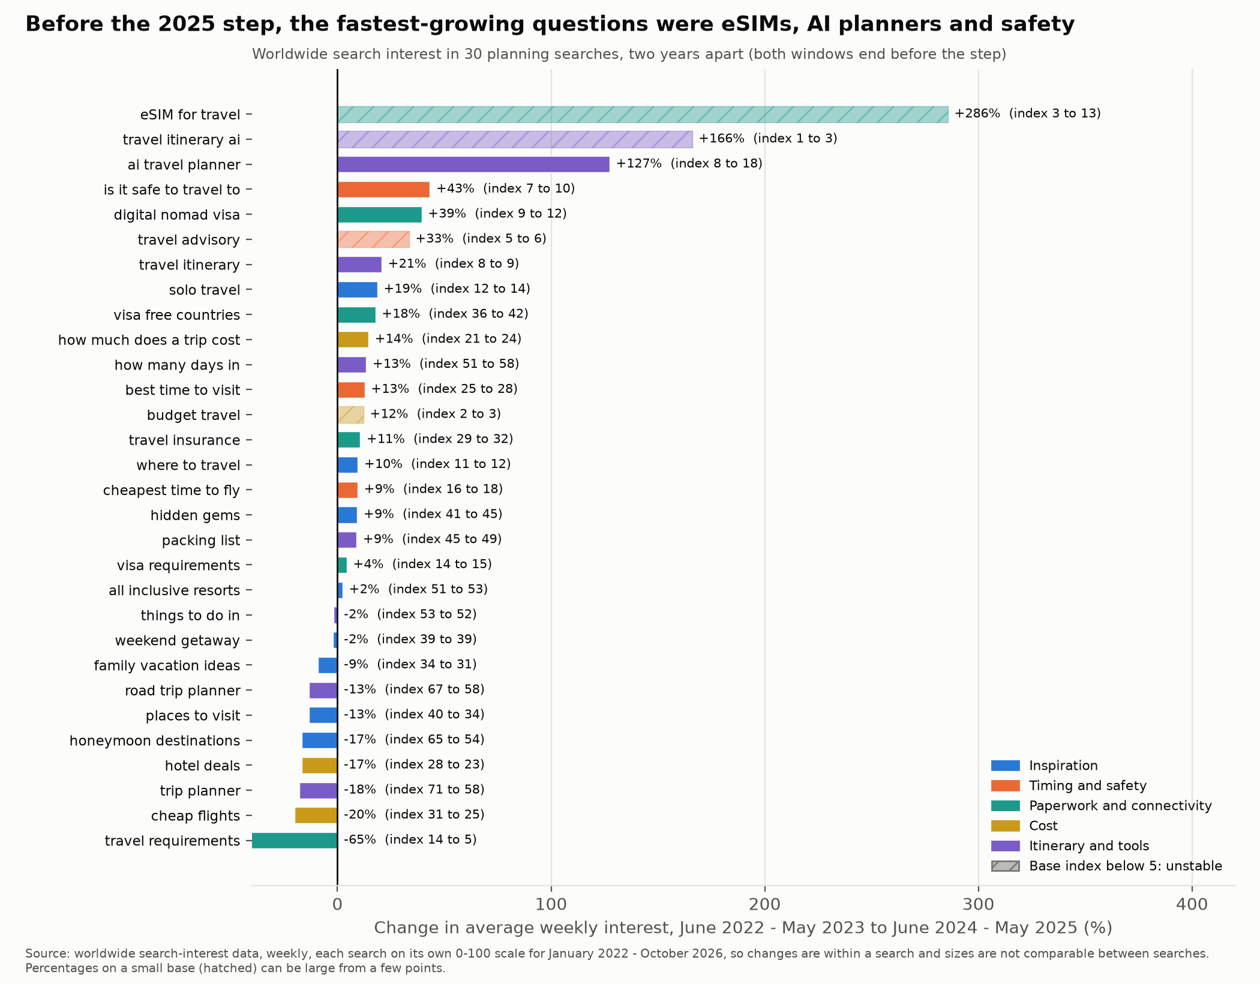
Change in planning searches before the 2025 step
Comparing June 2022 to May 2023 with June 2024 to May 2025, two windows that both end before the step, the biggest gains were in a small set of questions. “ai travel planner” rose from an average index of 8 to 18 (+127%). “eSIM for travel” rose from 3 to 13 (+286%, on a small base), and “travel itinerary ai” from 1 to 3 (also tiny). “Is it safe to travel to” rose from 7 to 10 (+43%) and “digital nomad visa” from 9 to 12 (+39%). Core planning questions grew slowly: “best time to visit” +13%, “travel insurance” +11%, “how many days in” +13%.
Some fell. “Cheap flights” went from 31 to 25 (-20%), “trip planner” from 71 to 58 (-18%), “honeymoon destinations” from 65 to 54 (-17%) and “hotel deals” from 28 to 23 (-17%). A broad pattern in the data is that the generic planner and deal searches lost ground while safety, connectivity and AI-assisted planning gained. The index is relative to each search’s own highest week in January 2022 to October 2026, so a percentage on a small base, such as the eSIM figure, is large even where few searches were involved. The table below puts the numbers for twelve of the searches side by side.
Finding 5: Where interest in timing questions is rising
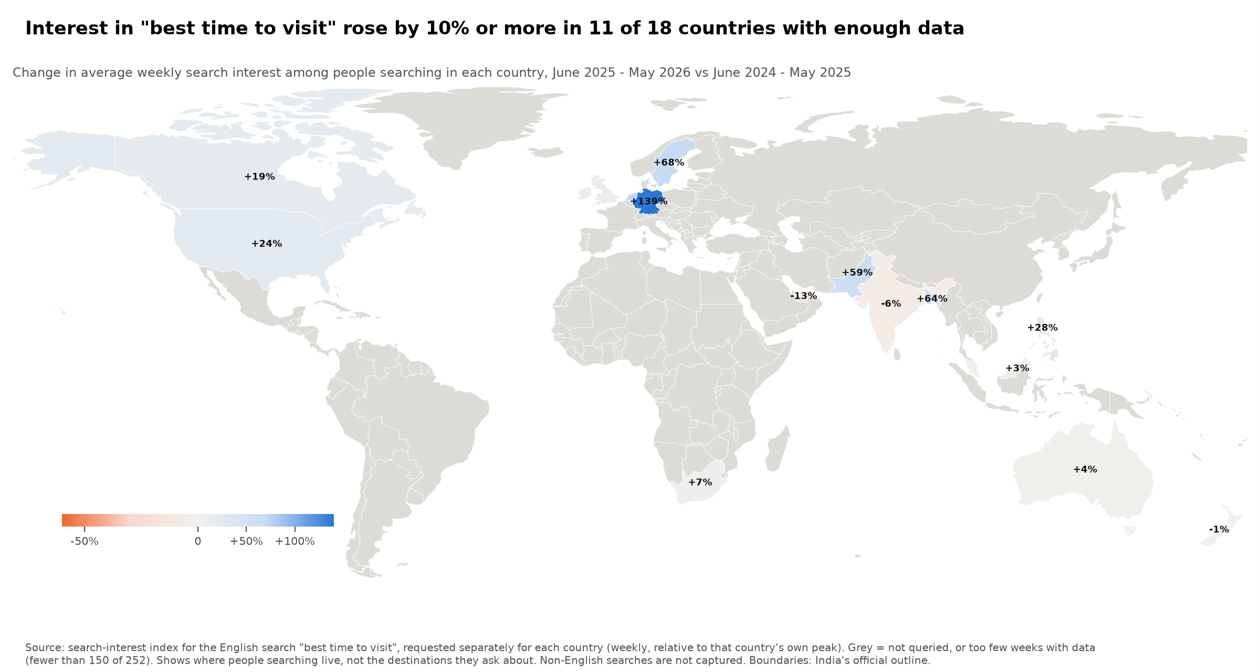
Change in “best time to visit” interest by country
To locate rising interest we requested “best time to visit” separately for 30 countries and kept the 18 with at least 150 weeks of data in 252. Comparing June 2025 to May 2026 with the 12 months before, interest rose by 10% or more in 11 of the 18: Germany (+139%), the Netherlands (+71%), Sweden (+68%), Bangladesh (+64%), Pakistan (+59%), the Philippines (+28%), Hong Kong (+27%), the United States (+24%), Canada (+19%), and Ireland and the United Kingdom (+13% each). It was flat in Singapore (+6%), South Africa (+7%), Australia (+4%), Malaysia (+3%) and New Zealand (-1%), and lower in India (-6%) and the United Arab Emirates (-13%).
The three largest rises are on small bases (an average index of 5 in Germany, 10 in the Netherlands and 13 in Sweden in the earlier window), so they are less certain than the rises in the United States and Canada, where the index was already 38 and 37. The map shows where the searching happens, not which destinations are asked about, and covers English-language searches, which leaves out most of Europe, Latin America and East Asia. A map of destinations was not possible from the data we had, and a true world map of rising destination interest is the main gap in this article.
Finding 6: What the news is talking about, and which themes are rising or falling
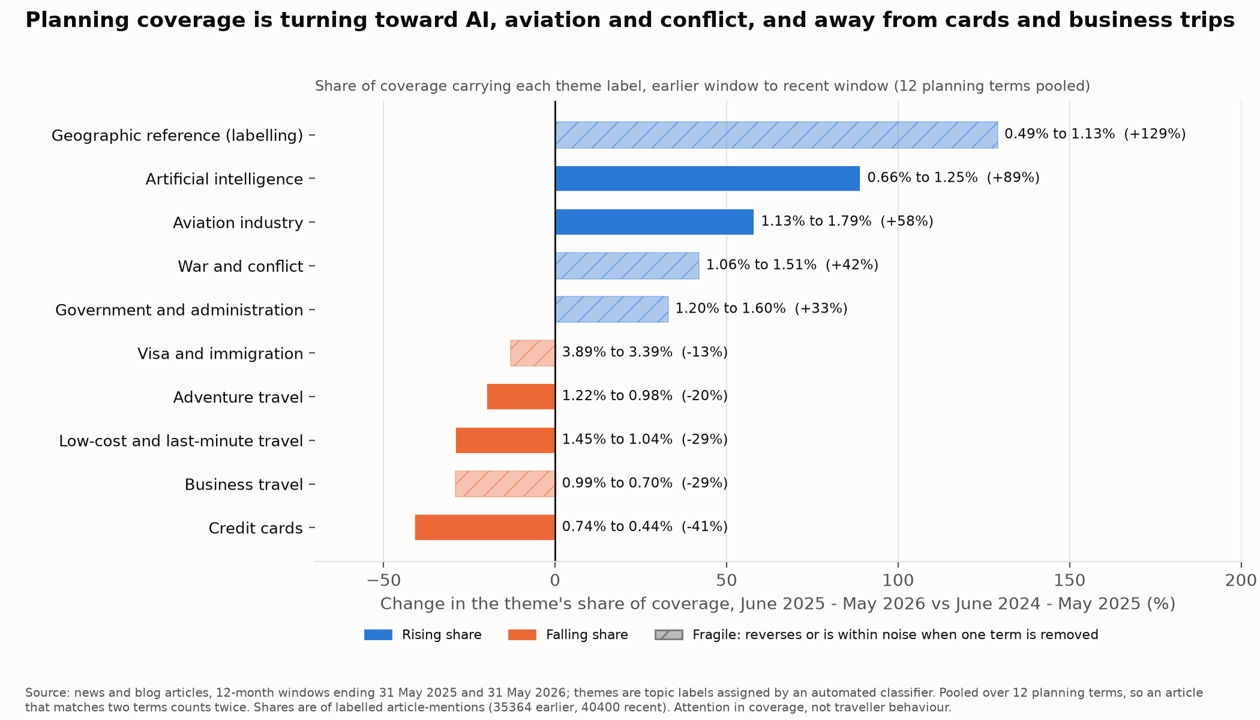
Rising and falling news themes
News and blog coverage shows what the conversation is about, not how large demand is. We compared the topic themes of articles that mention 12 planning terms (trip planning, travel planning, travel itinerary, best time to visit, travel insurance, visa-free travel, solo travel, budget travel, travel advisory, AI travel planner, packing list and cheap flights) in two equal windows: June 2024 to May 2025 (earlier) and June 2025 to May 2026 (recent). News ingest thins after May 2026, so the recent window ends on 31 May 2026. A theme is one of the topic labels that an automated classifier assigns to each article, and its share is the share of labelled article-mentions that carry it. The base was 35,364 labelled mentions in the earlier window and 40,400 in the recent one (+14.2%). The number of articles that mention the 12 terms rose by about the same amount, 14,189 to 16,170 (+14.0%).
Rising themes.
- Artificial intelligence (articles on machine learning and AI) rose from 0.66% to 1.25% of coverage (+89%), from 234 to 505 labelled mentions. This holds when any single one of the 12 terms is removed.
- Aviation industry (airlines, aircraft and airport news) rose from 1.13% to 1.79% (+58%), and also holds without any one term.
- War and conflict rose from 1.06% to 1.51% (+42%), but it reverses or loses significance when travel insurance coverage is removed, so we hatch it.
- Government and administration (departmental and administrative announcements) rose from 1.20% to 1.60% (+33%), but it is not robust without the travel advisory term.
- Geographic reference rose from 0.49% to 1.13% (+129%). This is a generic classifier label and we cannot give it a plain meaning, so we treat it as a labelling artefact and hatch it.
Falling themes.
- Credit cards fell from 0.74% to 0.44% (-41%).
- Low-cost and last-minute travel fell from 1.45% to 1.04% (-29%).
- Adventure travel (activity travel such as trekking and rafting) fell from 1.22% to 0.98% (-20%).
- Business travel fell from 0.99% to 0.70% (-29%), but it is not robust when the “travel planning” term is removed, which carries most of the pool.
- Visa and immigration fell from 3.89% to 3.39% (-13%), and it is not robust without the visa-free travel term, whose own coverage fell by a quarter.
The coverage matches the search findings in part. AI rose in both. Advisory coverage rose in news (the advisory term +73%), as safety did in the search question lists. Budget and last-minute themes fell in news while the search data carried a step for the same words, a disagreement that is one reason we do not read the step as demand.
The numbers side by side
| Search | Question group | Index, Jun 2022 to May 2023 | Index, Jun 2024 to May 2025 | Index, Jun 2025 to May 2026 | Change before the step | Step ratio, Aug-Sep vs May-Jul 2025 |
| ai travel planner | Itinerary and tools | 8 | 18 | 60 | +127% | 2.52 |
| eSIM for travel | Paperwork and connectivity | 3 | 13 | 54 | +286% | 2.75 |
| is it safe to travel to | Timing and safety | 7 | 10 | 19 | +43% | 0.81 |
| digital nomad visa | Paperwork and connectivity | 9 | 12 | 42 | +39% | 4.78 |
| travel itinerary | Itinerary and tools | 8 | 9 | 33 | +21% | 2.16 |
| best time to visit | Timing and safety | 25 | 28 | 41 | +13% | 1.40 |
| visa requirements | Paperwork and connectivity | 14 | 15 | 56 | +4% | 4.31 |
| travel insurance | Paperwork and connectivity | 29 | 32 | 64 | +11% | 1.43 |
| budget travel | Cost | 2 | 3 | 31 | +12% | 7.25 |
| cheap flights | Cost | 31 | 25 | 48 | -20% | 2.51 |
| trip planner | Itinerary and tools | 71 | 58 | 57 | -18% | 0.96 |
| things to do in | Itinerary and tools | 53 | 52 | 59 | -2% | 1.03 |
Each index is that search’s own weekly interest on a 0 to 100 scale (100 = its highest week from January 2022 to October 2026), averaged over the window. Sizes are not comparable between rows. A step ratio of 1.5 or more is marked as a step in the text. The full 30-search table is provided with the data tables.
What to take from it
For readers planning a trip, the data suggest that the planning conversation has two new centres of gravity: tools that build the plan, including AI, and questions about whether it is safe and allowed to go now. Both sit before the booking, and both are about reducing uncertainty. For operators and destination managers, the evidence supports building content around current safety, entry rules and connectivity, as well as around timing and itinerary, and it does not support reading the 2025 jump in search interest as a change in demand. For researchers, the open problem is the summer 2025 step: a check against bookings or official arrivals for the same weeks would show whether it reflects travel. A 2027 reading will need the same searches measured for November 2026 onward, which can be added to the same method.
Method note and limitations
Data and analysis. The news, search and research-paper analysis in this article was run with Fliar Prism (Fliar Business Intelligence, 2026a), and the research tools it uses are published as the open-source Prism MCP (Fliar Business Intelligence, 2026b).
Search interest. Search interest is a relative index from search-volume data, weekly, from January 2022 to October 2026 and worldwide unless stated. It is not a count of searches. Each of the 30 searches was requested on its own, so its index runs from 0 to 100 against its own highest week. This shows movement within a search, not size. The 30 searches were chosen by us as common planning phrases across five stages, so a different set would change the numbers. We did not compute confidence intervals for the search changes. The latest weeks of the series are incomplete, and several fall sharply in September and October 2026, so we use full windows ending 31 May 2026.
Related searches. The leading related searches for each of nine questions are the relative values returned for 12-month windows. Within a group the top search is 100; values cannot be compared between groups, and the data source returned between 10 and 25 related searches per group and window. Bare place names, brand names and unrelated words (for example news and shopping searches) were removed from the chart and from the AI share.
The 2025 step. We defined a step as the ratio of the average of 10 August to 30 September 2025 to the average of 1 May to 13 July 2025 being at least 1.5. The threshold is our choice. We could not find its cause.
Country map. Country series are one request per country for “best time to visit” in English, so they under-represent non-English-speaking markets. Countries with fewer than 150 of 252 weeks with data (including Sri Lanka, Nepal and Kenya) were dropped. Each country’s series is relative to its own peak, so growth is comparable within a country but not between countries. Boundaries follow India’s official outline (Survey of India, no date).
News. Counts and themes come from news and blog articles. A theme comparison pools 12 terms over two 12-month windows, so an article that matches two terms counts twice. Only each term’s 80 highest-ranked labels were returned, so small themes may be undercounted. A two-proportion test with 2.0 as the cut-off flags noise; it treats mentions as independent, which flatters significance because articles repeat across outlets. A theme is marked fragile if removing any single term reverses it or brings it within noise. Two terms (“sustainable tourism” and “tourism recovery”) were collected and left out because they are not planning terms and dominated the pool. News counts by month use a mention match, so a term can over-count.
Not delivered from the original pitch. The pitch listed customer reviews, community discussions, drawings, absolute search volumes and a map of rising destination interest. None of the first two is included, because they could not be sourced in a form that could be analysed by period. Search volumes are given as a relative index. Charts and a map are provided in place of drawings. The map shows where people search from, not which destinations rise, and it is limited to English searches in 18 countries. Research-paper evidence was not used. The “geo intelligence” element is limited to that map.
References
Eurostat (no date) Tourism statistics [Statistics Explained]. Available at: https://ec.europa.eu/eurostat/statistics-explained/index.php?title=Tourism_statistics (Accessed: 1 November 2026).
Fliar Business Intelligence (2026a) Fliar Prism: news, search and research-paper analysis [Data and analysis platform]. Available at: https://fliarbi.com/prism/ (Accessed: 27 October 2026).
Fliar Business Intelligence (2026b) Prism MCP: open-source research tools [Software]. GitHub. Available at: https://github.com/fliarbi/prism-mcp (Accessed: 27 October 2026).
Survey of India (no date) Survey of India. Available at: https://surveyofindia.gov.in/ (Accessed: 1 November 2026).